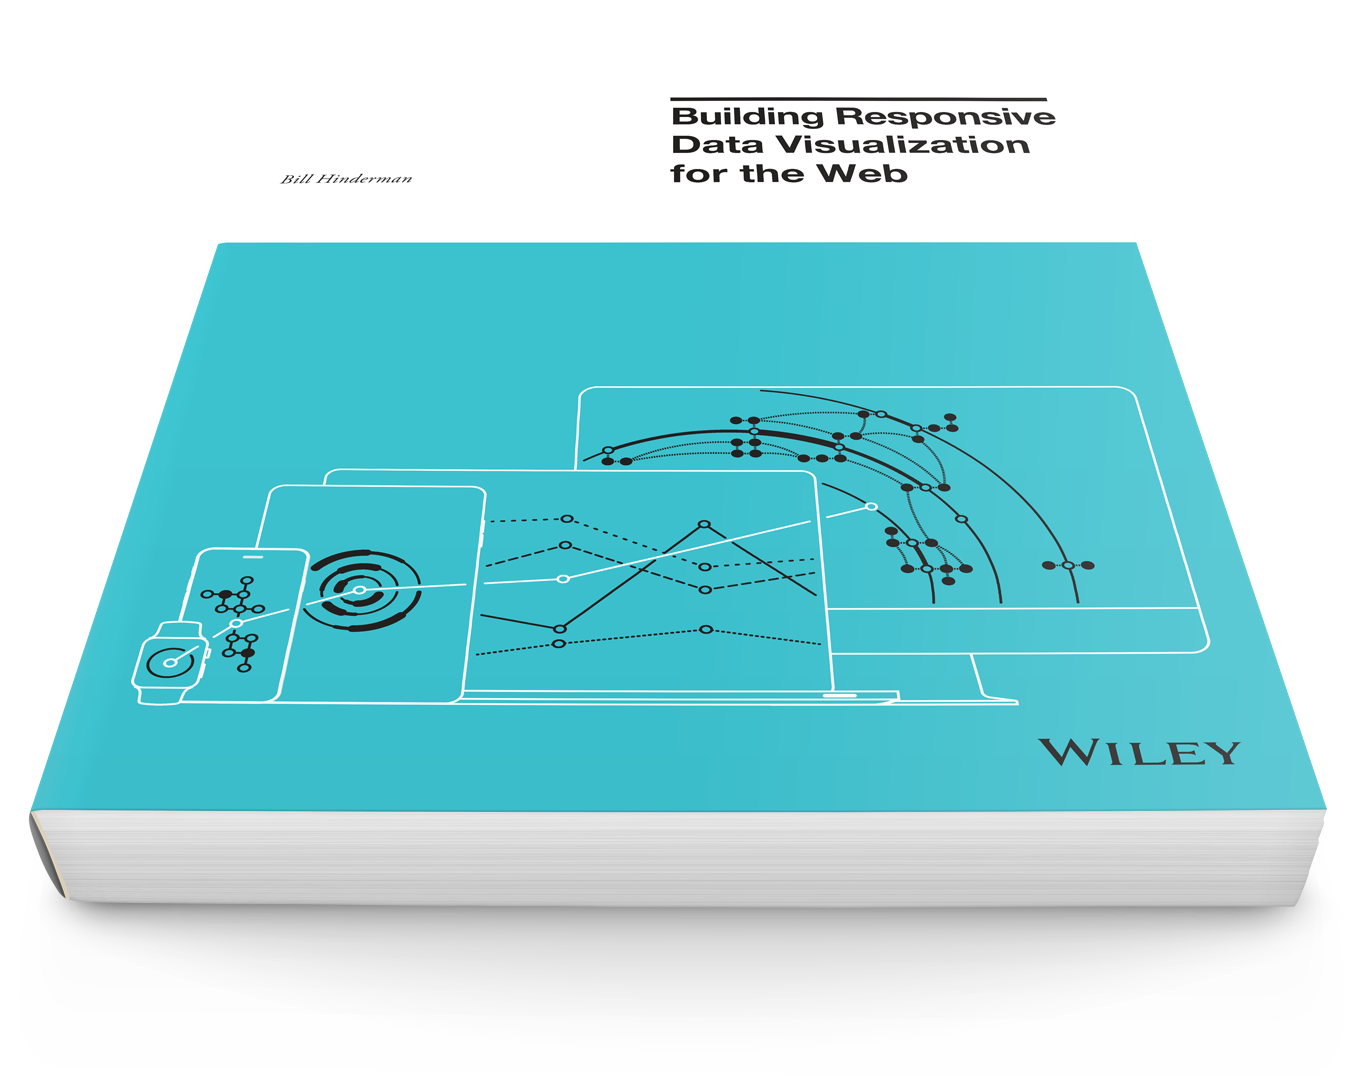
With more than 1.4 billion smart phones and at least half as many tablets in use, there is a tremendous need for responsive web design in the data visualization sphere. Building Responsive Data Visualization for the Web answers the call for guidance with an authoritative and practical guide based on responsive web design principles.
Bill Hinderman draws upon his UI development and web design expertise to show you how to build data visualizations that retain clarity and effectiveness no matter where or how they’re accessed.
You’ll start by developing a working understanding of responsive design as you learn your way around the flexible grid, then you’ll apply those skills to data as you master the fine points of data visualization and bring it to the web with a content-first perspective.
Building Responsive Data Visualization for the Web provides strategies for teams of any size or skill set, so you can:
- Think responsively from the beginning of any project
- Use and adapt the principles of responsive web design
- Evolve current data strategies to responsive workflows
- Use HTML to build and JavaScript to enhance
- Design visualizations for any screen and any browser
- Build code-driven visualizations with D3.js
Table of Contents
Select a chapter to read a snippet or explore its exercises.
-
01
The Mobile Web
Before discussing responsive data design, it is important to set the stage with a brief overview of how we got here. The evolution of the mobile web does not exist in a vacuum; it is built upon the foundation of 25 years of the Internet’s growth.
-
02
Responsive Web Design Tenets
Before breaking out all of our tools, it’s important to set some guiding principles about how to build responsively responsibly. In this chapter, you will examine the foundations of responsive web design, including the guiding principles of your design process—being universal, flexible, economical, and specific. Also covered are seven focal points to build upon as our material becomes more technical.
-
03
Working With A Flexible Grid
The grid is the very base level of responsive design. We tailor our grid to both the viewport’s dimensions and the typographic needs of the website in order to create a visual hierarchy, while relying on a mathematical system to keep our design maintainable.
-
04
Designing With CSS
Building CSS responsively is the linchpin, the idea that shifts our efforts from building flexible websites to building responsive websites. This difference will become clearer as some terms are defined, but think of both fluidity and responsiveness as tools in your adaptive tool belt. Fluidity enables you to grow and shrink your content based upon its container. Responsiveness enables you to ask the container more about its attributes, and change how you handle your content. We’re the first apes to touch the monolith.
-
05
Enhancing With JavaScript
As we reach the last layer of the progressive enhancement tower, it’s important to remember how far you can get without reading this chapter. Fluid grids, media queries, and flexible imags are the core of responsive web design. JavaScript is how you will bridge the gap from web design to complex responsive data visualization.
-
06
Data: An Abridged History
Until this point, you have not been considering how your content would affect your design. In this section, layout will still be a major contributing factor to how you design, but you will also begin to consider how your actual content (your data) impacts how you produce a product for end users. In this chapter, you’ll take a brief look at a set of useful terms for thinking about data visualization on the responsive web.
-
07
Responsive Data Visualization Tenets
As you push toward building more complex, data-driven applications on the web, it’s important to understand the many parallels between responsive data visualization and responsive design as a whole. In this chapter, we’ll revisit some of the core tenets established throughout the book so far, adding clarity and specificity to how they relate to data visualization. You’ll also learn some new principles for guiding how you build visualizations for the web.
-
08
Think Small
Until now, the smallest screen you have considered has still been a screen. In this chapter, you’re going to shrink the available real estate even further and begin your data visualization development at an even more basic level: the user without a screen. You’ll learn to build API-first, rather than mobile-first, in order to create the most efficient, communicative representation of your data. From there, you’ll be able to work with discrete, efficient data sets which you can group and layer to create effective visualizations.
-
09
Asset Dependence
This chapter is the last piece of radically new information presented in this book before you start merging everything you’ve learned in the preceding chapters into a working whole. In this chapter, you are going to look at how JavaScript’s D3 library works, and learn how to react not to client feature changes, but rather to changes in the data backing your visualizations.
-
10
Drawing With Code
Throughout this book, you have been moving steadily toward a code-driven, device-independent way of designing and thinking. On the visualization side, you have even built for users without screens. Now it’s time to bring together your knowledge of building resolution-agnostic web experiences with your understanding of clean, granular API construction in order to create lightweight, responsive data visualizations.
-
11
Building The Future-Friendly Web
It’s time to move away from implementation details and look at the bigger picture. Responsive design is not just a solution for the current state of devices, but a way to build proactively—anticipating the likely needs of future users in order to provide the best experience. This chapter ties the knowledge you’ve gained throughout this book to a more theoretical discussion about just how you should think about building web experiences.
-
A
Appendix: Resources
Resources, example code, and relevant blogs can all be found here.
